

Overview — What is this template?
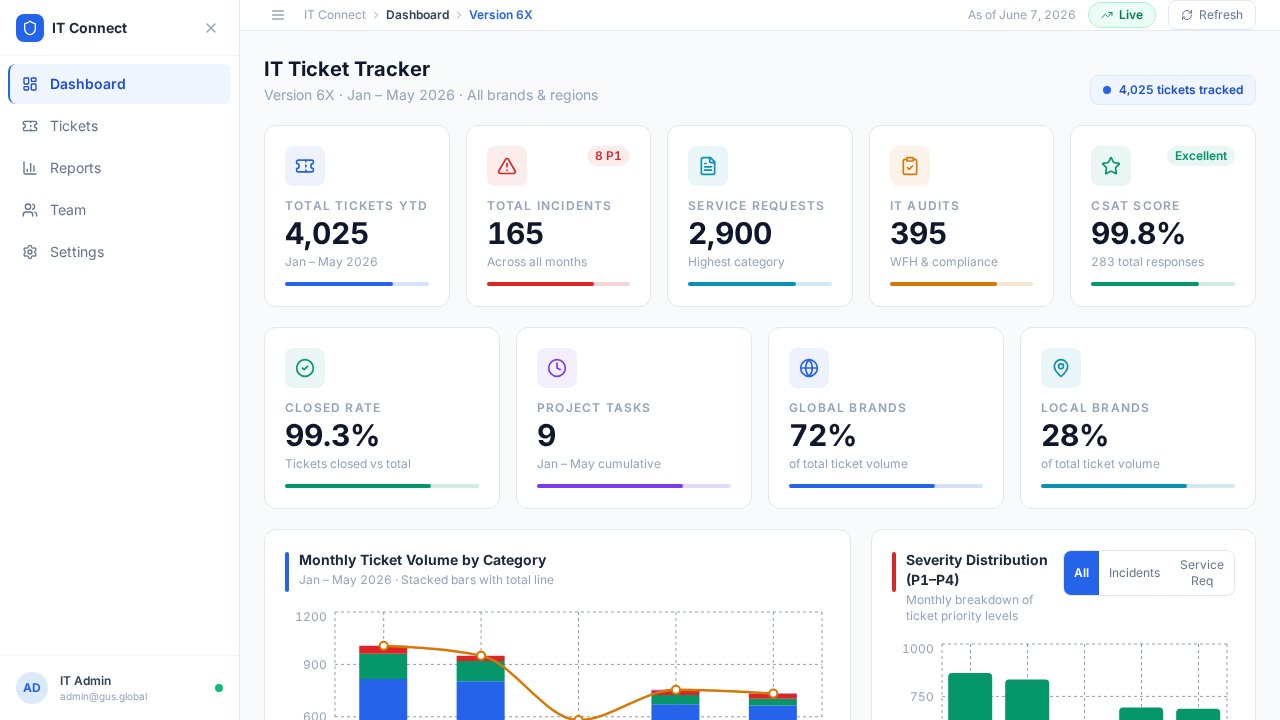
The Corporate IT Performance Dashboard is a professional, light, and modern grid template designed to help IT departments and operations managers track and report service metrics with precision. Serving as a centralized control center, this admin dashboard combines visual elegance with structured data representation to compile tickets, system incidents, CSAT scores, and audit compliance metrics. Built using a clean and intuitive card layout, it allows technology leaders to transform raw ITSM exports into a sleek, presentation-ready dashboard. This template helps organizations maintain complete visibility over their service delivery pipelines, allowing users to drill down into historical trends and handle multi-brand or regional monitoring without interface clutter.
Key highlights
- Eight color-coded KPI summary cards
- Stacked bar chart with overlaid trend line
- Severity distribution with tab-segmented filters
- Multi-brand and regional scoping navigation
- Live status indicator with manual refresh control
- Collapsible sidebar with five major administrative sections
Who is it for?
- IT Managers and Directors: Need to aggregate ticket volumes and team performance metrics for monthly or quarterly reviews.
- ITSM Operations Leads: Require a live view of incident severity distributions and regional service queues to optimize staff allocation.
- Compliance and Audit Officers: Need a reliable visual archive of security audits, SLA compliance, and system health status.
- Executive Stakeholders: Seek a high-level, easily digestible snapshot of organizational CSAT scores and critical infrastructure health.
Best use cases
- Monthly Performance Reviews: Synthesize monthly ticket resolutions, active incidents, and regional performance metrics into a single layout for executive presentations.
- Cross-Functional SLA Reporting: Demonstrate SLA compliance, response times, and customer satisfaction metrics to business unit leaders and partner organizations.
- Multi-Brand IT Operations: Monitor and compare helpdesk ticket categories and infrastructure performance across separate corporate divisions or subsidiaries.
- IT Compliance Audits: Provide internal and external compliance auditors with a structured, transparent historical record of system performance and incident response.
How to build with Enter
- Remix the IT Dashboard: Click the "Remix Template" button on this page to create your own editable instance of the Corporate IT Performance Dashboard within your Enter Pro workspace.
- Customize with Enter Agent: Chat with Enter Agent to link your real-time ITSM tools, replace the placeholder metrics, update brand colors, configure database schemas, and define access control roles.
- Deploy to Enter Cloud: One-click publish your completed system to get a secure, responsive URL with built-in analytical capabilities, ready for internal sharing or stakeholder presentations.
FAQ
What is the Corporate IT Performance Dashboard? It is a modern, light-themed admin dashboard designed to aggregate and visualize key helpdesk metrics, incident severities, and compliance audits for IT leadership.
Can I modify the layout and metrics of this template? Yes, you can fully customize every block, card, color scheme, and chart type using Enter Pro’s visual editor or by chatting with Enter Agent.
Does this dashboard require active coding to set up? No coding experience is required. You can manage your layouts visually and use Enter Agent to build live data connections and backend logic.
Is this template optimized for mobile view? Yes, the responsive grid layout automatically refactors to deliver a clean, readable mobile view for executive stakeholders checking metrics on the go.
Can I connect this dashboard to live databases? Yes, you can use Enter Cloud’s native Database and Functions capabilities to link this interface directly to your incident tracking software or databases.